
Abstract
This report introduces a powerful method for automating Google Analytics tasks using the Gemini CLI and a custom MCP (Model Context Protocol) server built with Google Apps Script. This integration enables streamlined web page analysis through simple natural language commands, simplifying authorization and complex data retrieval workflows.
Introduction
Accessing and interpreting web analytics data often involves navigating complex interfaces and manual report generation. However, the emergence of natural language interfaces is changing this paradigm. Gemini CLI, when paired with MCP servers, allows users to orchestrate sophisticated, multi-step workflows using conversational commands. This creates a more intuitive and efficient way to interact with powerful services like Google Analytics.
Building on my previous reports for Google Sheets, Calendar, and Classroom, this article demonstrates how to apply this automation to Google Analytics.
- Next-Level Data Automation: Gemini CLI, Google Sheets, and MCP
- Next-Level Data Automation: Gemini CLI, Google Calendar, and MCP
- Next-Level Classroom Automation: Gemini CLI, Google Classroom, and MCP
While Google has provided a Python-based MCP server for this purpose (Ref), this guide introduces an alternative built with Google Apps Script. The primary advantage of this approach is its ability to seamlessly authorize Google Analytics via Advanced Google services, significantly simplifying the initial setup. By integrating Google Analytics tools into the existing ToolsForMCPServer library (Ref), we unlock more versatile and powerful automations.
Practical Applications and Sample Prompts
The following examples showcase how natural language prompts can be used to query the Google Analytics Data API for valuable insights. For complete setup and usage instructions, please refer to the repository: https://github.com/tanaikech/ToolsForMCPServer?tab=readme-ov-file#usage
1. Get Google Analytics Properties
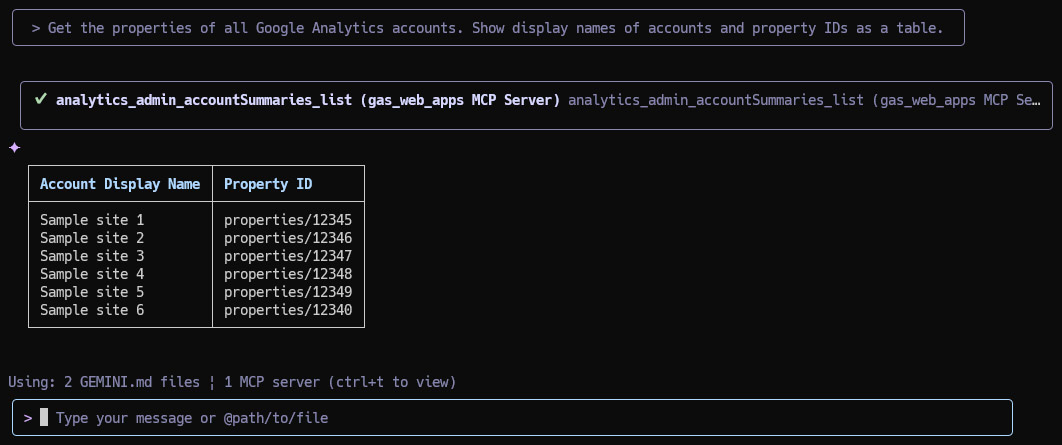
Quickly list all associated accounts and property IDs to get an overview of your assets.
Prompt:
Get the properties of all Google Analytics accounts. Show display names of accounts and property IDs as a table.
2. Track Daily Active Users
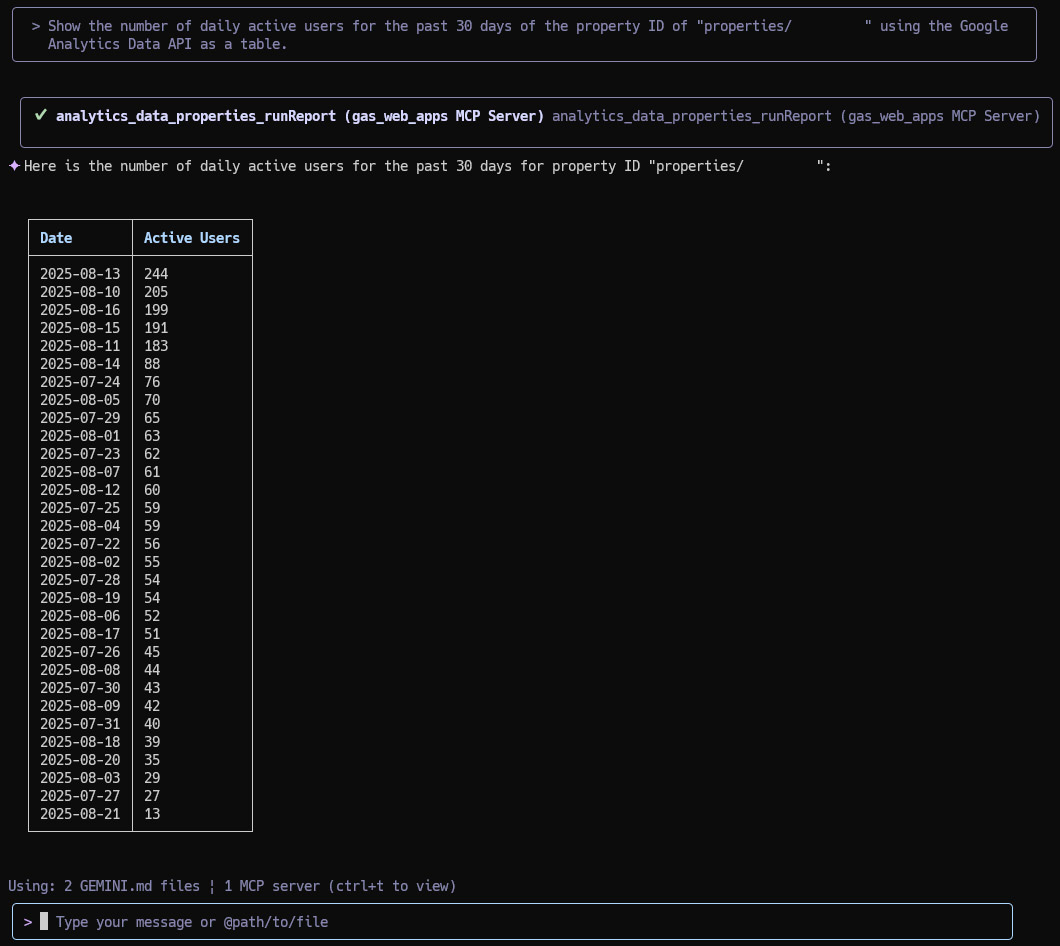
Generate a report of daily active users over the last month to monitor engagement trends.
Prompt:
Show the number of daily active users for the past 30 days of the property ID of "properties/###" using the Google Analytics Data API as a table.
3. Analyze Sessions by Device
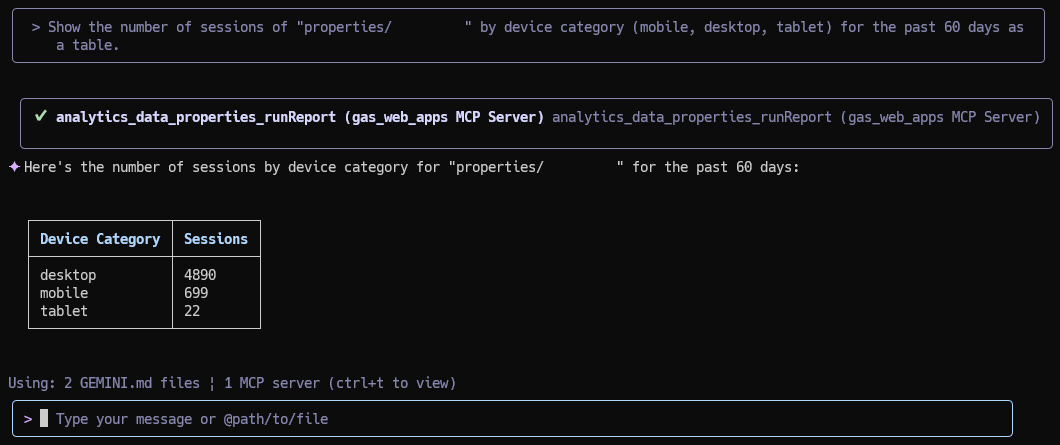
Understand how users access your site by segmenting sessions by device category.
Prompt:
Show the number of sessions of "properties/###" by device category (mobile, desktop, tablet) for the past 60 days as a table.
4. Identify Top User Countries
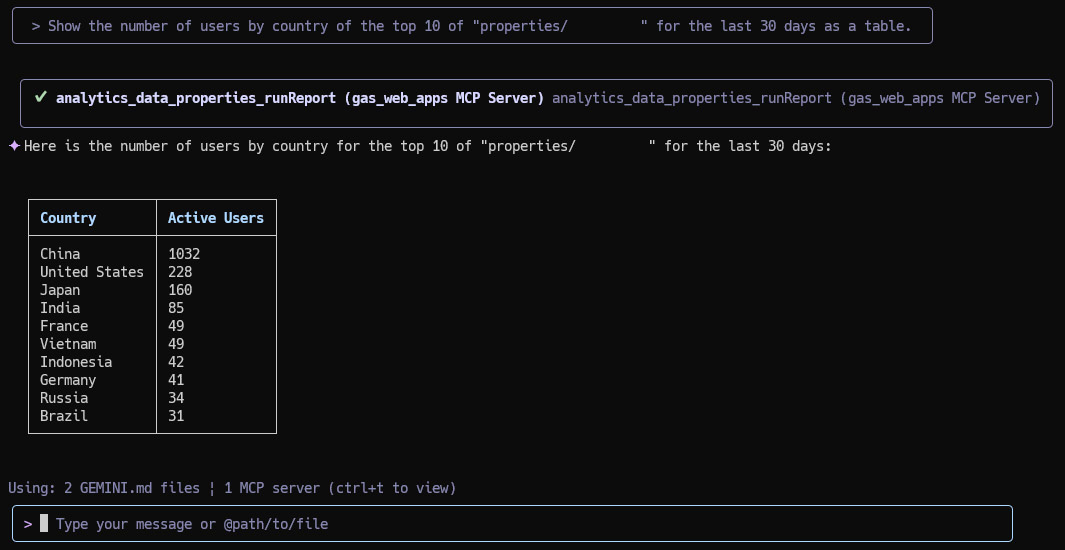
Discover your top 10 geographic audiences by analyzing user data from the past month.
Prompt:
Show the number of users by country of the top 10 of "properties/###" for the last 30 days as a table.
5. Automate Data Retrieval and Email Reporting
Combine multiple steps into a single command to fetch key metrics and email them as a formatted report.
Prompt:
Run the following mission.
1. Retrieve the sessions, page views, and users for 1 week of "properties/###" using the Google Analytics Data API.
2. Create the retrieved data as a table.
3. Send an email by including the table to tanaike@hotmail.com.
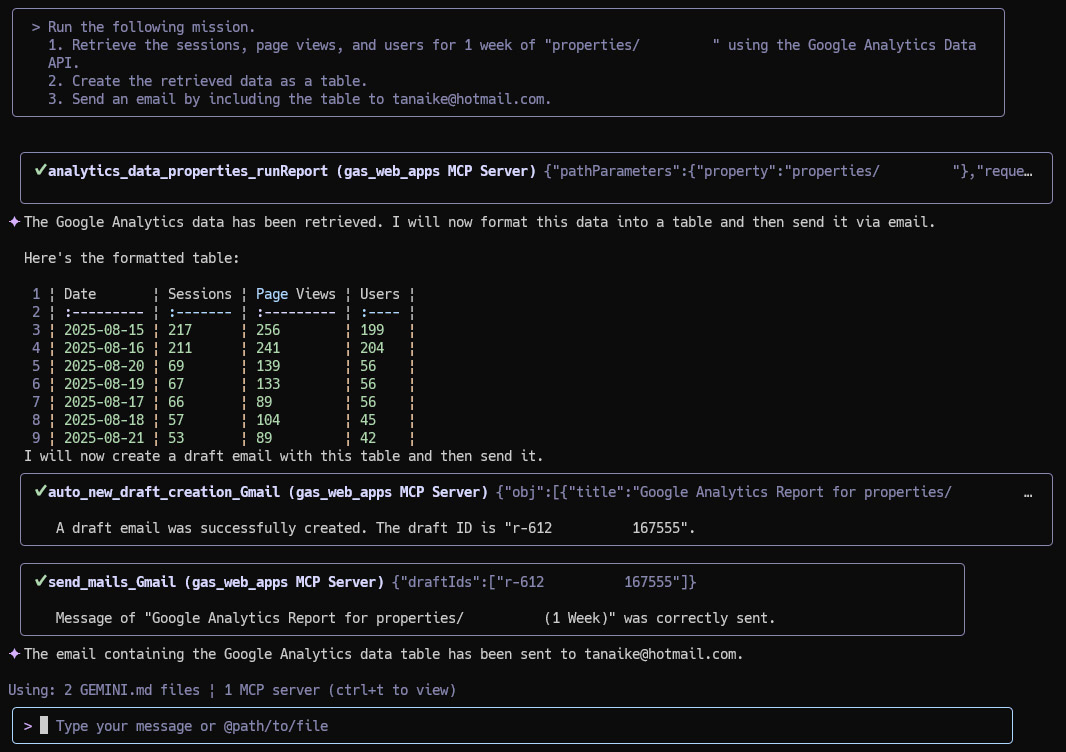
The resulting email body would contain a clean, markdown-formatted table:
Here is the Google Analytics report for properties/### for the
week of August 15, 2025, to August 21, 2025:

| Date   	| Sessions | Page Views | Users |
| :--------- | :------- | :--------- | :---- |
| 2025-08-15 | 217  	| 256    	| 199   |
| 2025-08-16 | 211  	| 241    	| 204   |
| 2025-08-20 | 69   	| 139    	| 56	|
| 2025-08-19 | 67   	| 133    	| 56	|
| 2025-08-17 | 66   	| 89     	| 56	|
| 2025-08-18 | 57   	| 104    	| 45	|
| 2025-08-21 | 53   	| 89     	| 42	|
6. Generate a Real-Time Report of Active Users by Country
Get an immediate snapshot of current site activity broken down by country.
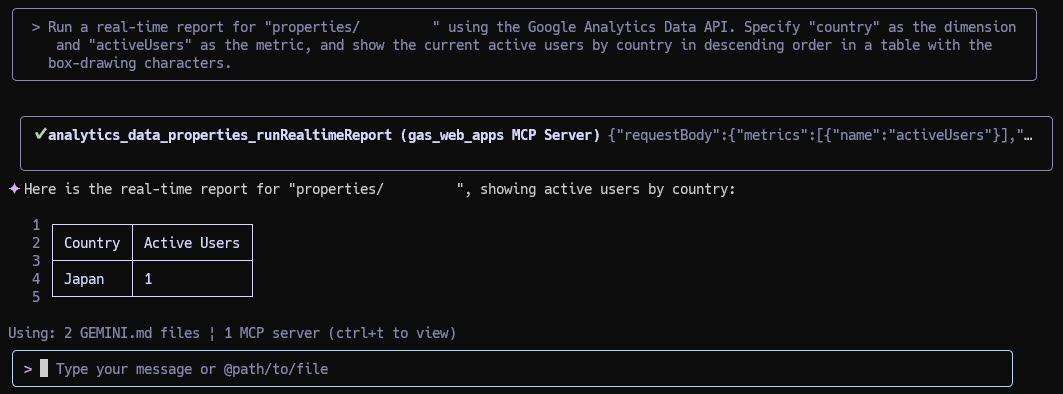
Prompt:
Run a real-time report for "properties/###" using the Google Analytics Data API. Specify "country" as the dimension and "activeUsers" as the metric, and show the current active users by country in descending order in a table with the box-drawing characters.
7. View a Real-Time Report of Top Active Pages
Identify the most popular content on your site at this very moment.
Prompt:
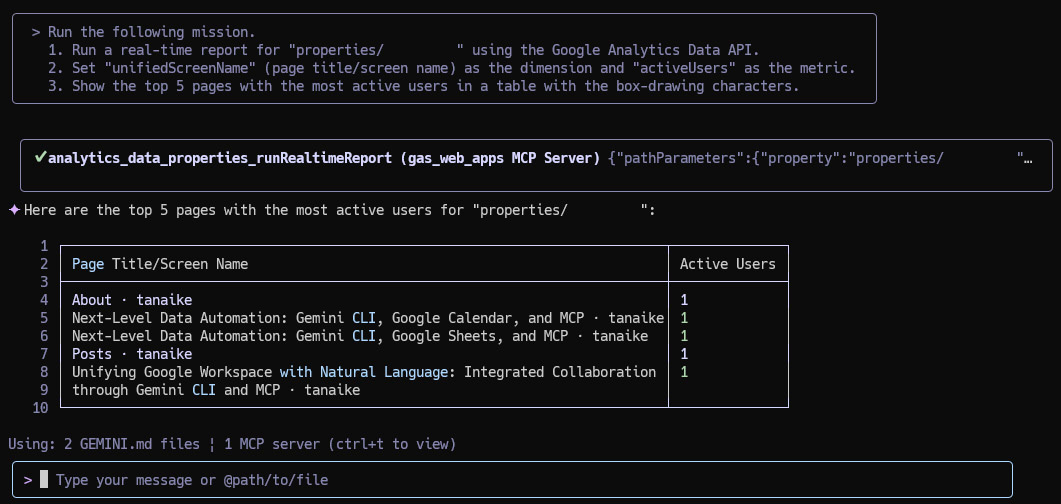
Run the following mission.
1. Run a real-time report for "properties/###" using the Google Analytics Data API.
2. Set "unifiedScreenName" (page title/screen name) as the dimension and "activeUsers" as the metric.
3. Show the top 5 pages with the most active users in a table with the box-drawing characters.
Summary
This report demonstrates a streamlined approach to interacting with Google Analytics. By leveraging natural language commands, users can simplify data retrieval and automate complex reporting tasks.
Here are the key takeaways:
- Natural Language Control: Gemini CLI allows you to manage Google Analytics using simple, conversational language, removing the need to navigate complex dashboards.
- Simplified Authorization: Using Google Apps Script for the MCP server streamlines the authentication process with Google services, making setup easier.
- Multi-Step Automation: The system can execute complex, multi-step “missions,” such as retrieving data, formatting it into a table, and sending it in an email, all from a single prompt.
- Real-Time Insights: You can access real-time website data, like top active pages or users by country, directly from the command line.
- Extensible Framework: The solution is built upon the
ToolsForMCPServerlibrary, allowing for easy expansion and the addition of more custom tools in the future.