
Abstract
A new large language model (LLM) called Gemini with an API is now available, allowing developers to analyze vast amounts of data. This report explores trends in Google Apps Script by using the Gemini 1.5 API to analyze questions on Stack Overflow.
Introduction
The release of the LLM model Gemini as an API on Vertex AI and Google AI Studio has opened a world of possibilities. Ref The Gemini API significantly expands the potential of various scripting languages, paving the way for diverse applications. Additionally, Gemini 1.5 has recently been released in AI Studio. Ref We can expect the Gemini 1.5 API to follow suit soon.
The difference between Gemini 1.0 and Gemini 1.5 is as following table created by Gemini.
https://gist.github.com/tanaikech/157bb4778149429e865d37312ad8a5da
| Feature | Gemini 1.0 | Gemini 1.5 |
|---|---|---|
| Number of parameters | 1.5T | 540B |
| Training data | 1.56T words | 1.56T words |
| Model architecture | Transformer-based decoder-only | Transformer-based decoder-only with MoE |
| Context window size | 32k tokens | 1M tokens |
| Inference speed | 10x faster than GPT-3 | 2x faster than Gemini 1.0 |
| Performance on language benchmarks | SOTA on GLUE, SuperGLUE, and CoQA | SOTA on GLUE, SuperGLUE, CoQA, and Winograd Schema Challenge |
| Availability | Invite-only beta | Public beta |
Given Gemini 1.5’s ability to analyze large data, this report leverages the Gemini 1.5 API to analyze trends in Google Apps Script from the data of questions on Stackoverflow. We achieve this by examining all questions tagged google-apps-script from 2008 to 2024 (only 2024, from January to March 28) on Stack Overflow.
Step
The steps of this analysis are as follows.
1. Retrieve questions from Stackoverflow
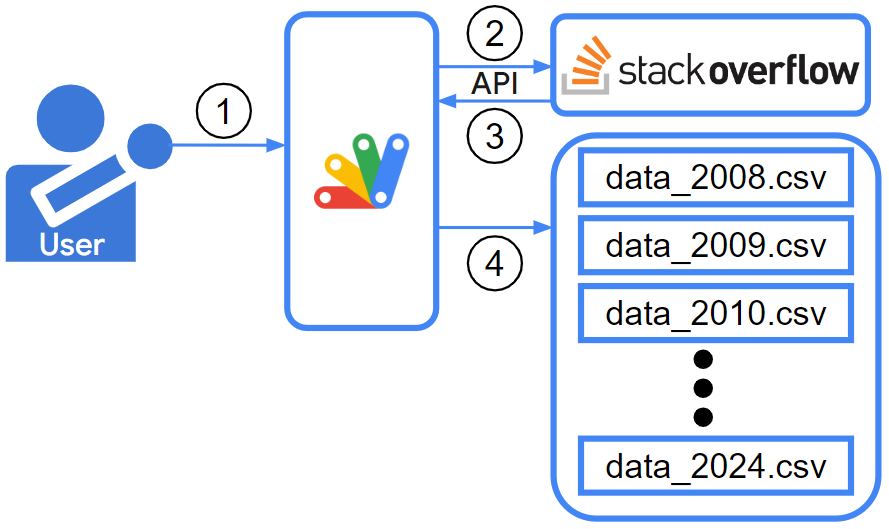
As the base data of Stackoverflow, I used the data retrieved at “Trend of google-apps-script Tag on Stackoverflow 2024”. In that report, all questions including a tag google-apps-script from 2008 to 2024 have already been retrieved. The data from January 1, 2024, to March 28, 2024, was retrieved in this report. All data is retrieved by StackExchange API. Ref This flow can be seen in the above image. As a result, 17 CSV files including the data from Stackoverflow were created. The total number of questions including google-apps-script tag from 2008 to March 28, 2024, on Stackoverflow was 54,135.
2. Generate texts for each year
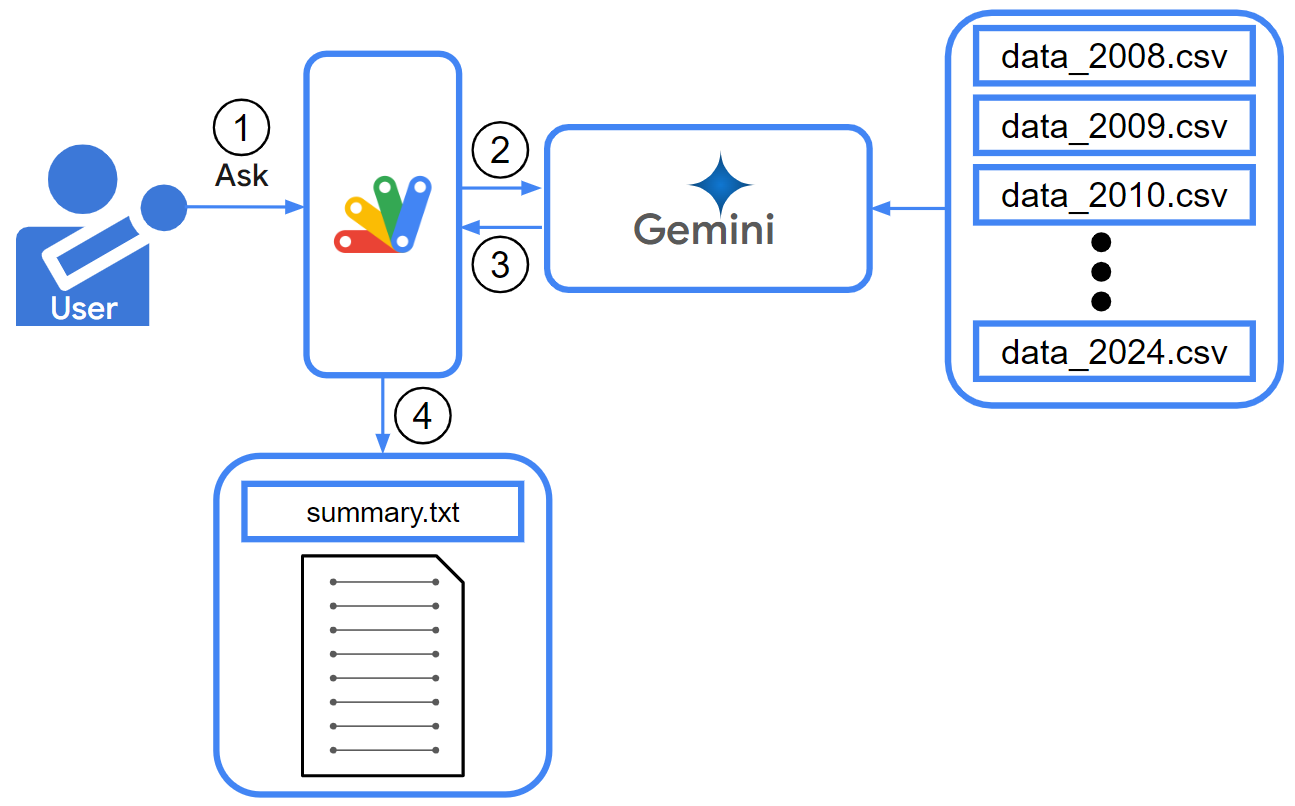
As the next step, each summary is created from the retrieved 17 CSV files using Gemini 1.5 API. Because in the current stage, all 17 CSV data cannot be directly used by one API call. So, I separated them. This flow can be seen in the above image. By this flow, a text file including the summaries of each year was created.
3. Generate text from all year
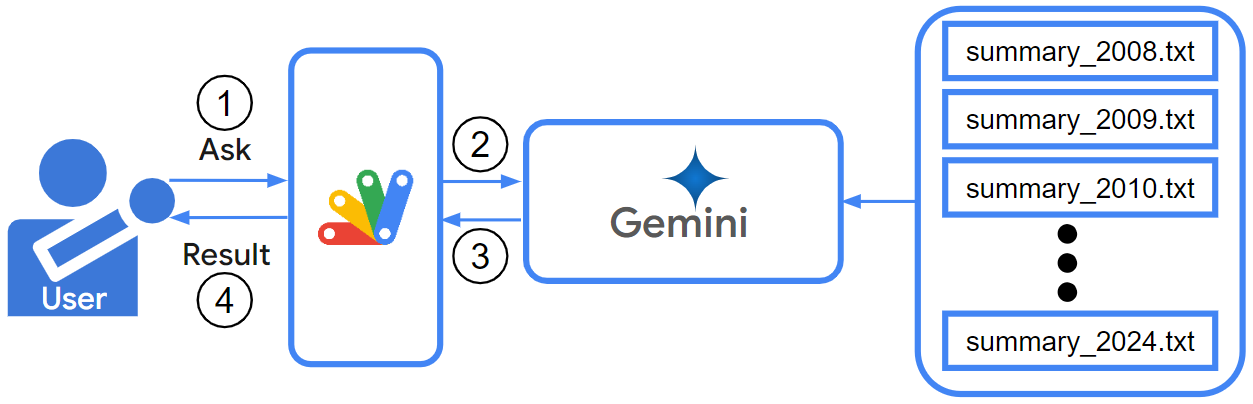
As the next step, a summary is created from a text file including summaries from 2008 to 2024. This flow can be seen in the above image. By this flow, the summary of all data from 2008 to 2024 is created.
Usage
In order to test this script, please do the following steps.
1. Create an API key
Please access https://makersuite.google.com/app/apikey and create your API key. At that time, please enable Generative Language API at the API console. This API key is used for this sample script.
This official document can be also seen. Ref.
2. Create a Google Apps Script project
In this report, Google Apps Script is used. Of course, the method introducing this report can be also used in other languages.
Please create a standalone Google Apps Script project. Of course, this script can be also used with the container-bound script.
And, please open the script editor of the Google Apps Script project.
3. Base data
Here, prepare the data as described in the section “1. Retrieve questions from Stack Overflow.” In this report, we focus on the values of “creation_date,” “title,” “score,” and “tags.” While I initially wanted to include the body of the question, it significantly increased the number of tokens for processing. Therefore, the body was excluded. However, I believe the trend can still be obtained from the remaining values: “creation_date,” “title,” “score,” and “tags.”
4. Base script
The base script for processing this analysis is as follows. Please copy and paste the following script to the script editor of Google Apps Script and save the script.
In this script, the model models/gemini-1.5-pro-latest was used for generating texts.
/**
 * Sample script for this report.
 */
class DoGemini {
  /**
   * @param {Object} object Object using this library.
   */
  constructor(object = {}) {
    const model = "models/gemini-1.5-pro-latest";

    this.baseUrl = `https://generativelanguage.googleapis.com/v1beta/${model}`;
    this.apiKey = object.apiKey || null;
    this.headers = object.apiKey
      ? null
      : {
          authorization: `Bearer ${object.token || ScriptApp.getOAuthToken()}`,
        };
    this.retry = 5;
    this.folderId = object.folderId || "root";

    this.object = object;
  }

  /**
   * ### Description
   * Create summaries for each year of the data.
   *
   * @returns {String} A file ID of the file including the created summaries.
   */
  createSummariesOfEachYear() {
    const headerText = ["creation_date", "title", "score", "tags"].join(",");
    const files = DriveApp.getFolderById(this.folderId).getFilesByType(
      MimeType.CSV
    );
    const fileList = [];
    while (files.hasNext()) {
      const file = files.next();
      const csv = file.getBlob().getDataAsString().trim() || "No data.";
      const filename = file.getName();
      fileList.push({ filename, csv });
    }
    if (fileList.length == 0) {
      throw new Error("No CSV files.");
    }
    fileList.sort((a, b) => (a.filename > b.filename ? 1 : -1));
    console.log(
      `--- File list\n${JSON.stringify(
        fileList.map(({ filename }) => filename),
        null,
        2
      )}`
    );

    const res = fileList.map(({ filename, csv }) => {
      console.log(`Now processing: ${filename}`);
      const q = [
        `Summary the trend from the following CSV data. The CSV data is questions related to Google Apps Script in Stackoverflow. Namely, summarize the trend of questions on Stackoverflow from CSV data.`,
        `Consider the creation date of the first column.`,
        `Consider the affection of the advent of AI.`,
        `Consider the history of Google Apps Script.`,
        `Include a value, that you evaluated the activity level of Google Apps Script between 1 and 100, in the response without overestimating.`,
        ``,
        `${filename}`,
        `The format of CSV data is as follows.`,
        ``,
        `[Format of CSV data]`,
        `Created date of the question, Title of the question, Score of the question, Tags related to the question`,
        ``,
        `[CSV data]`,
        `${headerText}`,
        `${csv}`,
      ].join("\n");
      const summary = this.generateContent_(q);
      return { filename, ...summary };
    });
    return DriveApp.getFolderById(this.folderId)
      .createFile("summariesOfEachYear.txt", JSON.stringify(res))
      .getId();
  }

  /**
   * ### Description
   * Create a summary of all years.
   *
   * @param {String} fileId File ID including summaries of each year.
   * @returns {String} A file ID of the file including the created summary.
   */
  createSummaryOfAllYears(fileId) {
    if (!fileId) {
      throw new Error(
        "Please set the file ID of the file including summaries of each year."
      );
    }
    const headerText = ["year", "summary"].join(",");
    const data = JSON.parse(
      DriveApp.getFileById(fileId).getBlob().getDataAsString()
    );
    const csv = data.map((e) => `${e.filename},${e.response}`).join("\n");

    // const csv = data.map(e => `${e.filename},'${JSON.stringify(e.response).replace(/'/, "\'")}'`).join("\n");
    const q = [
      `Summary the trend from the following CSV data. The CSV data is the summary of trend of questions related to Google Apps Script in Stackoverflow every year. The summaries were created by Gemini API.`,
      `Consider the each year of the first column.`,
      `Consider the affection of the advent of AI.`,
      `Consider the history of Google Apps Script.`,
      `At the last of summary, add all values, that you evaluated the activity level of Google Apps Script between 1 and 100, in the response without overestimating. Output the values as an array. The array format is [["year", "activity value"],["year", "activity value"],,,].`,
      ``,
      `The format of CSV data is as follows.`,
      ``,
      `[Format of CSV data]`,
      `year, Summary of trend of questions`,
      ``,
      `[CSV data]`,
      `${headerText}`,
      `${csv}`,
    ].join("\n");
    const { response } = this.generateContent_(q);
    return DriveApp.getFolderById(this.folderId)
      .createFile("summaryOfAllYears.txt", response)
      .getId();
  }

  /**
   * ### Description
   * Count tokens of inputted values with Gemini API.
   *
   * @param {Object} options Object for UrlFetchApp.
   * @returns {Object} totalTokens
   */
  countToken_(options) {
    const url =
      `${this.baseUrl}:countTokens` +
      (this.apiKey ? `?key=${this.apiKey}` : "");
    const res = this.fetch_({ url, ...options });
    return JSON.parse(res.getContentText());
  }

  /**
   * ### Description
   * Generate content with Gemini API.
   *
   * @param {String} q Text for prompt.
   * @returns {UrlFetchApp.HTTPResponse|String[]} Response from API. When pageToken is used, String[] is returned.
   */
  generateContent_(q) {
    const payload = { contents: [{ parts: [{ text: q }], role: "user" }] };
    const options = {
      payload: JSON.stringify(payload),
      contentType: "application/json",
      muteHttpExceptions: true,
    };
    if (this.headers) {
      options.headers = headers;
    }
    const totalTokens = this.countToken_(options);

    console.log(totalTokens); // Confirm the total tokens in the log.

    const url =
      `${this.baseUrl}:generateContent` +
      (this.apiKey ? `?key=${this.apiKey}` : "");
    const res = this.fetch_({ url, ...options });
    const obj = JSON.parse(res.getContentText());
    if (
      obj.candidates &&
      obj.candidates.length > 0 &&
      obj.candidates[0].content.parts.length > 0
    ) {
      return { totalTokens, response: obj.candidates[0].content.parts[0].text };
    } else {
      this.retry--;
      console.warn("No response. Retry again.");
      if (this.retry > 0) {
        this.generateContent_(q);
      } else {
        console.error("No response.");
      }
    }
  }

  /**
   * ### Description
   * Request Gemini API.
   *
   * @param {Object} obj Object for using UrlFetchApp.fetchAll.
   * @returns {UrlFetchApp.HTTPResponse} Response from API.
   */
  fetch_(obj) {
    obj.muteHttpExceptions = true;
    const res = UrlFetchApp.fetchAll([obj])[0];
    if (res.getResponseCode() != 200) {
      throw new Error(res.getContentText());
    }
    return res;
  }
}
5. Script for “Generate texts for each year”
This script creates a text file including summaries from 2008 to 2024. The file is created in the same folder as the CSV files. Of course, you can also see each summary from the file.
function process1() {
  const apiKey = "###"; // Please set your API key.

  const object = {
    apiKey,
    folderId: "###", // Please set the folder ID of the folder including 17 CSV files including data from Stackoverflow.
  };
  const dg = new DoGemini(object);
  const res = dg.createSummariesOfEachYear();
  console.log(res);
}
When this script is run, the number of tokens for each year can be seen at the following chart.
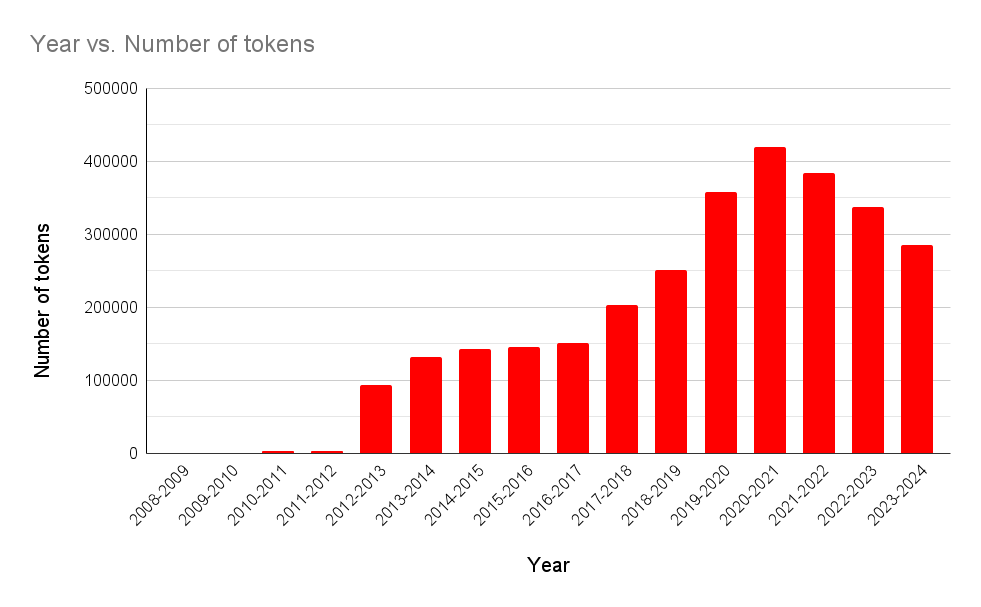
This chart reveals that the number of tokens exceeds 32,000 in most years. In this context, the Gemini 1.5 API has proven to be a valuable tool.
6. Script for “Generate text from all year”
This script creates a text file of a summary of the trend of all questions including a tag google-apps-script posted from 2008 to 2024. In this case, the result file is created in the root folder.
function process2() {
  const apiKey = "###"; // Please set your API key.
  const fileId = "###"; // Please set the file ID of a text file including summaries of each year.

  const object = { apiKey };
  const dg = new DoGemini(object);
  const res = dg.createSummaryOfAllYears(fileId);
  console.log(res);
}
Result
When the above scripts are run, the following result is obtained.
## Summary of Google Apps Script Activity on Stack Overflow:

Based on the provided summaries of Google Apps Script questions on Stack Overflow from 2008 to 2024, we can observe the following trends:

**Early Stage (2008-2009):**

* Minimal activity as the platform was in its early stages of development and adoption.

**Growth and Adoption (2010 onwards):**

* Gradual increase in questions, indicating growing interest and adoption.
* Focus on basic functionalities initially, followed by more complex and diverse topics as the platform matured.
* Active community participation and knowledge sharing.

**Impact of AI:**

* While not explicitly evident in the earlier data, the potential for AI integration with Google Apps Script is recognized and may influence future trends.

**Activity Level:**

* Estimated activity level between **60 and 70 out of 100**, indicating a healthy and active community with room for further growth.

**Specific Observations:**

* Common topics include:
    * Basic syntax and functionality
    * Integration with Google Sheets, Forms, and other Google products
    * Email automation
    * Data manipulation
    * Triggering scripts
    * Web app development
* Recurring challenges faced by users:
    * Authorization and permission errors
    * Understanding specific methods and syntax
    * Debugging scripts
    * Optimizing script performance

**Overall, the data suggests a steady and ongoing interest in Google Apps Script, with a growing user base and increasingly complex use cases. While AI integration is not yet a dominant theme, it has the potential to influence future trends and applications.**

**Estimated Activity Levels:**

Based on the analysis of each year's data, here's an array summarizing the estimated activity levels of Google Apps Script on Stack Overflow:
[ [“2008-2009”, 10], // Estimated low activity due to early stage [“2010-2011”, 30], // Moderate activity during early growth [“2011-2012”, 60], // Increasing activity and diversification of topics [“2012-2013”, 60], // Steady growth and expanding capabilities [“2013-2014”, 60], // Moderately active and engaged community [“2014-2015”, 65], // Consistent activity with focus on both basic and advanced functionalities [“2015-2016”, 75], // Healthy and active community, diverse topics covered [“2016-2017”, 70], // Consistent activity, focus on integrations and web app development [“2017-2018”, 70], // Steady interest, diverse use cases, and demand for advanced functionalities [“2018-2019”, 65], // Consistent activity, potential for future AI integration [“2019-2020”, 65], // Sustained interest, potential influence of AI in automation [“2020-2021”, 65], // Consistent activity, continued relevance and adoption [“2021-2022”, 75], // Vibrant and active community, growing adoption and complex use cases [“2022-2023”, 75], // Consistent activity, potential for AI integration in specific areas [“2023-2024”, 65], // Steady interest, focus on basic functionalities and integrations ]
**Note:** These activity levels are estimations based on the provided data and general knowledge of Google Apps Script's adoption and development. A more precise assessment would require access to a larger dataset and more detailed information about question topics and user engagement.
When the activity level is evaluated by Gemini 1.5 API for each year is exported as a chart, it becomes as follows.
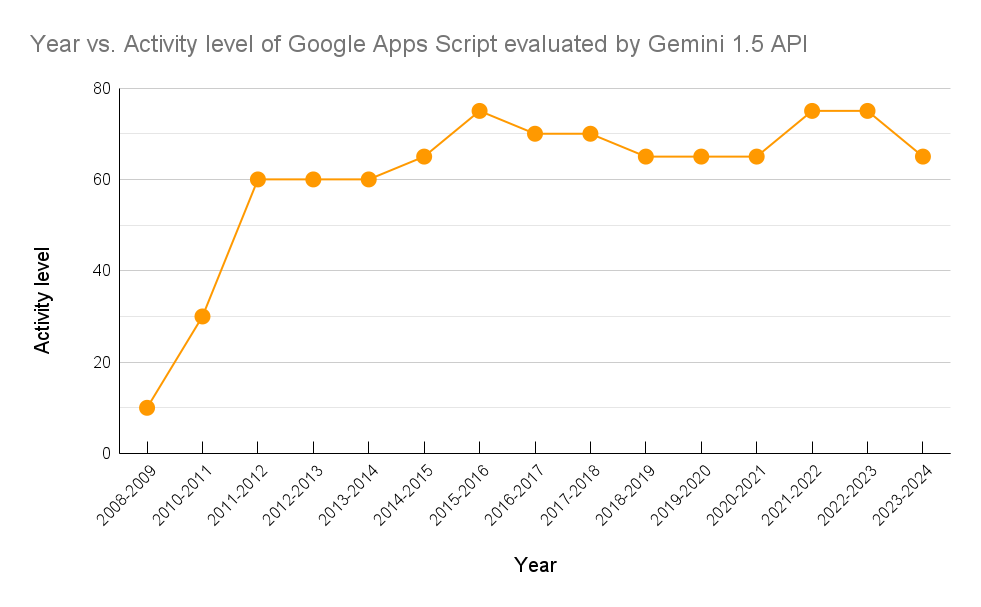
The above results confirm various insights about the trend of Google Apps Script on Stack Overflow. Additionally, the Gemini 1.5 API emerged as a valuable tool for data analysis.
Note
- The top illustration was created by Gemini with giving the abstract.