Abstract
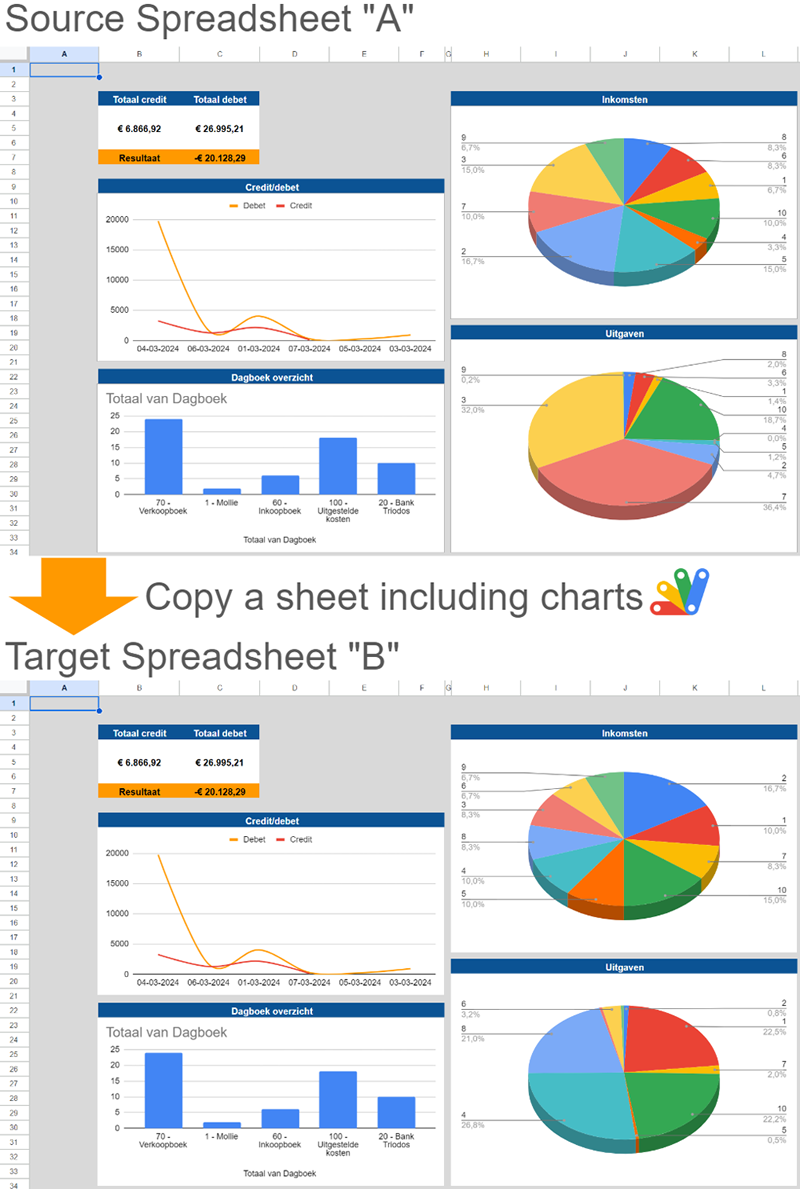
This report presents a workaround for copying a sheet, including its charts, from Google Spreadsheet “A” to Google Spreadsheet “B” using Google Apps Script.
Description
In this report, I would like to introduce a workaround for the following goal:
- Copying a sheet including charts from Google Spreadsheet “A” to Google Spreadsheet “B” using a script.
In general, when Sheets API is used, all objects of the Spreadsheet can be copied easily. However, when I tested this, I noticed the following problems:
- When the charts are retrieved with Sheets API,
aggregateTypeis not included in the object. Also,aggregateTypecannot be reflected in the charts. - There is a case where the value of
sourcesis not included in the propertysourceRange.
Due to this situation, I determined that Sheets API cannot be used for this scenario. Therefore, I attempted to achieve this using the Spreadsheet service (SpreadsheetApp) instead of Sheets API.
When the Spreadsheet service is used, I observed the following issues:
- When a chart in the source sheet of Spreadsheet “A” is copied to the target sheet of Spreadsheet “B,” the chart cannot be directly copied. However, I confirmed that it can be copied when the data range is modified.
- Here, the aggregate type is not included in the retrieved chart. However, I was able to confirm that the value of the aggregate type can be retrieved.
Based on these findings, I would like to propose a sample script for achieving the aforementioned goal as follows.
Note: In this sample script, Google Apps Script is executed using Node.js. Therefore, a Web App is deployed.
Usage
1. Prepare Google Apps Script project
Please create a Google Apps Script project. In this case, both the standalone type and the container-bound script type can be used.
2. Sample script
Please copy and paste the following script to the script editor of the Google Apps Script project.
/**
 * ### Description
 * Copying a sheet including charts from Google Spreadsheet "A" to Google Spreadsheet "B" using a script.
 *
 * @param {Object} object Object including source spreadsheet ID, source sheet name, and target spreadsheet ID.
 * @return {void}
 */
function main_(object) {
  const { srcSSId, srcSheetName, dstSSId } = object;

  // Copy the source sheet to the target Spreadsheet "B".
  const srcSheet =
    SpreadsheetApp.openById(srcSSId).getSheetByName(srcSheetName);
  const dstSS = SpreadsheetApp.openById(dstSSId);
  if (
    dstSS.getSheets().some((s) => s.getSheetName() == srcSheet.getSheetName())
  ) {
    throw new Error("Target sheet has already been existing.");
  }
  const dstSheet = srcSheet.copyTo(dstSS).setName(srcSheet.getName());

  // Remove all charts in the target sheet.
  dstSheet.getCharts().forEach((c) => dstSheet.removeChart(c));

  // Retrieve all charts in the source sheet, and update all charts for the target sheet.
  // And, insert the updated charts to the target sheet.
  const charts = srcSheet.getCharts();
  charts.forEach((c) => {
    const chart = c.modify();
    chart.getRanges().forEach((r) => {
      const dataSheet = r.getSheet();
      const dataSheetName = dataSheet.getSheetName();
      if (!dstSS.getSheets().some((s) => s.getSheetName() == dataSheetName)) {
        dataSheet.copyTo(dstSS).setName(dataSheetName);

        // If you want to copy only the cell values without the formulas, please use the following script.
        // const sheet = dstSS.insertSheet(dataSheetName);
        // const values = dataSheet.getDataRange().getValues();
        // sheet.getRange(1, 1, values.length, values[0].length).setValues(values);
      }
      chart.removeRange(r);
      chart.addRange(
        dstSS.getSheetByName(dataSheetName).getRange(r.getA1Notation())
      );
      chart.setOption(
        "applyAggregateData",
        c.getOptions().get("applyAggregateData")
      );
    });
    dstSheet.insertChart(chart.build());
  });

  // Refresh formulas in the target sheet.
  const dataRange = dstSheet.getDataRange();
  dataRange.createTextFinder("=").matchFormulaText(true).replaceAllWith("=@@@");
  dataRange.createTextFinder("=@@@").matchFormulaText(true).replaceAllWith("=");
}

/**
 * ### Description
 * This is used as Web Apps of GET method.
 *
 * @param {Object} e Event object for Web Apps.
 * @return {ContentService.TextOutput}
 */
function doGet(e) {
  try {
    main_(e.parameters);
  } catch ({ stack }) {
    return ContentService.createTextOutput(stack);
  }
  return ContentService.createTextOutput("Done.");
}
3. Deploy Web Apps
The detailed information can be seen in the official document.
Please set this using the script editor.
- On the script editor, at the top right of the script editor, please click “click Deploy” -> “New deployment”.
- Please click “Select type” -> “Web App”.
- Please input the information about the Web App in the fields under “Deployment configuration”.
- Please select “Me” for “Execute as”.
- Please select “Anyone” for “Who has access to the app:”.
- Please click “Deploy” button.
- On the script editor, at the top right of the script editor, please click “click Deploy” -> “Test deployments”.
- Copy Web Apps URL. It’s like
https://script.google.com/macros/s/###/exec.
-
When you modify the Google Apps Script of Web Apps, please modify the deployment as a new version. By this, the modified script is reflected in Web Apps. Please be careful about this.
-
You can see the details of this in my report “Redeploying Web Apps without Changing URL of Web Apps for new IDE (Author: me)”.
4. Testing
The sample Node.js script is as follows. Please replace webAppsUrl with your Web Apps URL. In this sample, it supposes that the charts are included in the sheet srcSheetName on Spreadsheet srcSSId, and, that sheet is copied to Spreadsheet dstSSId.
const params = {
  srcSSId: "###", // Please set source Spreadsheet ID.
  srcSheetName: "###", // Please set source sheet name.
  dstSSId: "###", // Please set target Spreadsheet ID.
};
const q = new URLSearchParams(params);
const webAppsUrl = "https://script.google.com/macros/s/{deploymentId}/exec";

fetch(`${webAppsUrl}?${q}`)
  .then((res) => res.text())
  .then((res) => console.log(res))
  .catch((err) => console.error(err));
In this script, the datasheet is copied from the source Spreadsheet to the target Spreadsheet to use in the charts.
When this script is run, the following result is obtained. The reason that the values of the pie chart are changed is due to the formulas of =RANDBETWEEN(1;10) in the datasheet.
As another approach, when a curl command is used, it becomes as follows.
curl -L "https://script.google.com/macros/s/{deploymentId}/exec?srcSSId=###&srcSheetName=###&dstSSId=###"
Note
- In this sample script, I cannot test all various charts. So, there might be charts that this script cannot be used. At that time, I would like to recommend checking the possibility of the chart parameters that the Spreadsheet service cannot retrieve.