Introduction
When we use HTML in the Google Apps Script project, in order to show the values from the Google Apps Script side, the HTML template is used. When I used the HTML template with a large value, I understood that the process cost can be reduced by devising a script. In this report, I would like to introduce the process cost of the HTML template using the benchmark.
As the result, it was clearly found that when an HTML table is created with Google Apps Script and shows the HTML table with the HTML template, the process cost becomes low. And also, it was found that in order to reduce the process cost for using the HTML template, it is required to prepare the HTML data with the Google Apps Script side.
Experimental procedure
In order to measure the process cost of the HTML template, I used the following sample situation.
- Create an HTML table by giving a value from Google Apps Script to the HTML template.
In order to achieve this, I prepared the following 2 patterns.
-
Create a 2-dimensional array in Google Apps Script, and gives the array to the HTML template, create an HTML table in the HTML template.
-
Create an HTML table in Google Apps Script, and gives the HTML table to the HTML template, show an HTML table in the HTML template.
As a sample value for measuring the process cost, a 2-dimensional array constructed by n rows and 10 columns was used. In this experiment, the number of rows is changed.
By the way, at GAS, the processing time is not stable as you know. So the average value for more than 100 times measurements was used for each data point which is shown in the figure. At this time, the fluctuation of the average values was less than 1 %. I worry that each detailed-data point in my environment might be different from that of other user’s environments. But I think that the trend of this result can be used.
Results and discussions
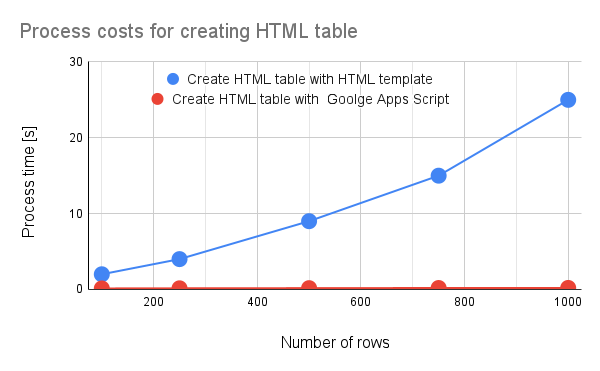
Fig 1. Process costs for creating an HTML table with HTML template and Google Apps Script.
Figure 1 shows the process costs for creating an HTML table with an HTML template and Google Apps Script. From this figure, it was clearly found that when an HTML table is created with Google Apps Script and shows the HTML table with the HTML template, the process cost becomes low. And also, it was found that when an HTML table is created with the HTML template, the process cost becomes high. This difference is very large.
Also, it was found that the reason for this high process cost is due to evaluate(). This indicates that when the script is run on the HTML template like <? for (var i = 0; i < data.length; i++) { ?>, the process cost will be high.
And, it is considered that in order to reduce the process cost for using the HTML template, it is required to prepare the HTML data with the Google Apps Script side.
Summary
In this report, the process costs for creating an HTML table on an HTML template have been investigated. From this report, the following result was obtained.
-
It was clearly found that when an HTML table is created with Google Apps Script and shows the HTML table with the HTML template, the process cost becomes low.
-
It was found that when an HTML table is created with the HTML template, the process cost becomes high.
-
In order to reduce the process cost for using the HTML template, it is required to prepare the HTML data with the Google Apps Script side.
The process cost of this report might be modified by future updates of Google.
Appendix
Sample scripts
Ths script used in this report is as follows. Here, as a sample, I used the container-bound script of Google Spreadsheet. And, the HTML template is used to a dialog on Spreadsheet.
HTML template: index1.html
This is from this official document.
<!DOCTYPE html>
<html>
  <head>
    <base target="_top" />
  </head>
  <body>
    <table>
      <? for (var i = 0; i < data.length; i++) { ?>
      <tr>
        <? for (var j = 0; j < data[i].length; j++) { ?>
        <td><?= data[i][j] ?></td>
        <? } ?>
      </tr>
      <? } ?>
    </table>
  </body>
</html>
HTML template: index2.html
In this template, the content of table is changed to <?!= data ?>.
<!DOCTYPE html>
<html>
  <head>
    <base target="_top" />
  </head>
  <body>
    <table>
      <?!= data ?>
    </table>
  </body>
</html>
Google Apps Script
function createSampleData_() {
  const maxRow = 100;
  const maxCol = 10;
  return [...Array(maxRow)].map((_, i) =>
    [...Array(maxCol)].map((_, j) => `(${i + 1},${j + 1})`)
  );
}

function measure1() {
  const data = createSampleData_();
  const html = HtmlService.createTemplateFromFile("index1");
  html.data = data;
  const h = html.evaluate();
  SpreadsheetApp.getUi().showDialog(h);
}

function measure2() {
  const data = createSampleData_();
  const html = HtmlService.createTemplateFromFile("index2");
  html.data = data.reduce(
    (s, r) => (s += `<tr>${r.map((c) => `<td>${c}</td>`).join("")}</tr>`),
    ""
  );
  const h = html.evaluate();
  SpreadsheetApp.getUi().showDialog(h);
}