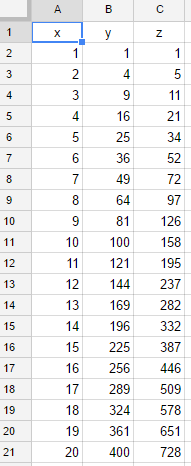
 var sheet = SpreadsheetApp.getActiveSpreadsheet().getActiveSheet();
 var chart = sheet.newChart()
    .setChartType(Charts.ChartType.LINE)
    .asLineChart()
    .addRange(sheet.getRange('a1:a21'))
    .addRange(sheet.getRange('b1:b21'))
    .addRange(sheet.getRange('c1:c21'))
    .setColors(["green", "red"])
    .setBackgroundColor("black")
    .setPosition(5, 5, 0, 0)
    .setPointStyle(Charts.PointStyle.MEDIUM)
    .setOption('useFirstColumnAsDomain', true)
    .setOption('height', 280)
    .setOption('width', 480)
    .setOption('title', 'Sample chart')
    .setOption('hAxis', {
      title: 'x axis',
      minValue: 0,
      maxValue: 20,
      titleTextStyle: {
        color: '#c0c0c0',
        fontSize: 20,
        italic: false,
        bold: false
      },
      textStyle: {
        color: '#c0c0c0',
        fontSize: 12,
        bold: false,
        italic: false
      },
      baselineColor: '#c0c0c0',
      gridlines: {
        color: '#c0c0c0',
        count: 4
      }
    })
    .setOption('vAxis', {title: 'y axis',
      minValue: 0,
      maxValue: 800,
      titleTextStyle: {
        color: '#c0c0c0',
        fontSize: 20,
        italic: false,
        bold: false
      },
      textStyle: {
        color: '#c0c0c0',
        fontSize: 12,
        bold: false,
        italic: false
      },
      baselineColor: '#c0c0c0',
        gridlines: {
        color: '#c0c0c0',
        count: 4
      }
    })
    .setOption('legend', {
      position: 'right',
      textStyle: {
        color: 'yellow',
        fontSize: 16
      }
    })
    .build();
    sheet.insertChart(chart);
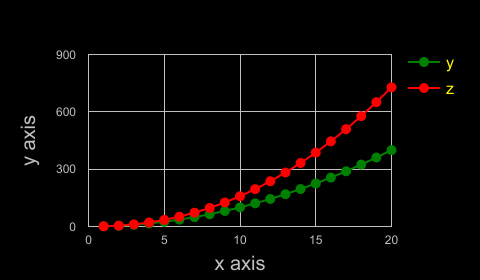
Reference pages are here and here.
Issue
Now (Sep 17, 2017), vAxis cannot be used. So I reported this here. https://issuetracker.google.com/issues/65781743 and https://issuetracker.google.com/issues/62511012.