Overview
This Google Apps Script helps identify and analyze regions of colored cells in a Google Sheet.
Description
Recently, I encountered a situation where I needed to identify colored cell regions in Google Sheets. For instance, consider the following spreadsheet:
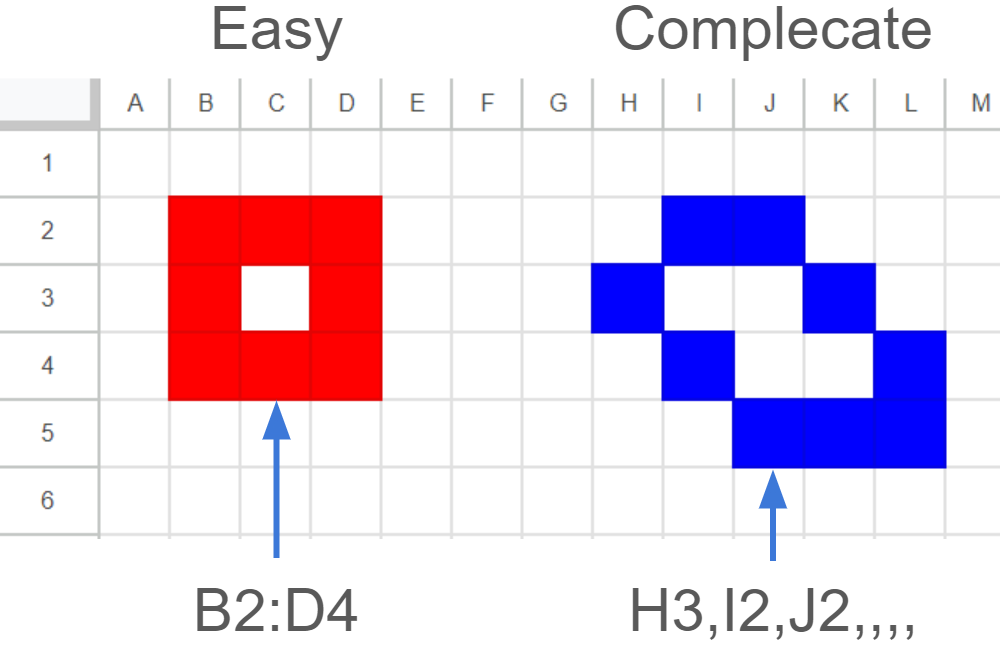
The region enclosed by the red cells (B2:D4) is a rectangle. In this case, the closed region can be easily identified using a simple script in Google Sheets. However, the region enclosed by the blue cells (H3, I2, J2,,,) is more complex. It consists of multiple disconnected cells that form a single shape. Identifying such irregular shapes using a script can be challenging.
In this report, I will introduce a sample script that can be used to identify complicated closed shapes like the one enclosed by the blue cells in the example. When this script is used, the closed regions can be filled in with colors, as shown in the top demonstration. This script also demonstrates a technique for working with cells on Google Sheets using Google Apps Script.
Usage
1. Create a new Google Spreadsheet
Please create a new Google Spreadsheet and open the script editor.
2. Base script
Please copy and paste the following script to the script editor and save the script. This script is used with the following sample scripts.
/**
 * Fill in cells by colors.
 */
class FillInCells {
  constructor() {
    this.sheet;
    this.objectFromGetObjectMethod;
    this.objectFromGetEachObjectsMethod;
  }

  /**
   * ### Description
   * Main method.
   *
   * @param {Object} object Object using this library.
   * @returns {Object[]} Object including the a1Notations and colors.
   */
  run(object) {
    const { range, defColor, fill } = object;
    const { offsetR, offsetC, maxR, maxC, backgrounds } =
      this.getInitValues_(range);
    const obj1 = this.getObject_({
      defColor,
      offsetR,
      offsetC,
      maxR,
      maxC,
      backgrounds,
    });
    const obj2 = this.getEachObjects_(obj1);
    const obj3 = this.getInsideRanges_(obj2);
    if (fill) {
      this.fillIn_(obj3);
    }
    return obj3;
  }

  /**
   * ### Description
   * Get initial values.
   *
   * @param {SpreadsheetApp.Range} range Range with this library.
   * @returns {Object} Values offsetR, offsetC, maxR, maxC, backgrounds.
   */
  getInitValues_(range) {
    this.sheet = range.getSheet();
    const offsetR = range.getRow() - 1;
    const offsetC = range.getColumn() - 1;
    const maxR = range.getNumRows() + offsetR;
    const maxC = range.getNumColumns() + offsetC;
    const backgrounds = range.getBackgrounds();
    return { offsetR, offsetC, maxR, maxC, backgrounds };
  }

  /**
   * ### Description
   * Get colored cells.
   *
   * @param {Object} object Values defColor, offsetR, offsetC, maxR, maxC, backgrounds.
   * @returns {Object} Object including each colord cells.
   */
  getObject_(object) {
    const { defColor, offsetR, offsetC, maxR, maxC, backgrounds } = object;
    const checks = backgrounds.reduce((ar, r, i, a) => {
      r.forEach((c, j) => {
        if (c != defColor) {
          const row = i + offsetR;
          const col = j + offsetC;
          const area = [];
          for (let ro = -1; ro <= 1; ro++) {
            for (let co = -1; co <= 1; co++) {
              if (
                ro + i > -1 &&
                co + j > -1 &&
                ro + i < maxR - offsetR &&
                co + j < maxC - offsetC &&
                a[ro + i][co + j] != defColor &&
                row + ro >= offsetR &&
                col + co >= offsetC
              ) {
                const temp = { row: row + ro, col: col + co };
                if (temp.row == row && temp.col == col) {
                  temp.center = true;
                  temp.color = c;
                }
                area.push(temp);
              }
            }
          }
          ar.push(area);
        }
      });
      return ar;
    }, []);
    const obj = checks.reduce((o, e) => {
      const t = e.find(({ center }) => center);
      o[`${t.row}_${t.col}`] = e;
      return o;
    }, {});
    this.objectFromGetObjectMethod = obj;
    return obj;
  }

  /**
   * ### Description
   * Get each objects in the sheet.
   *
   * @param {Object} obj Values from the method getObject_.
   * @returns {Object} Object including colored cell range as A1Notations.
   */
  getEachObjects_(obj) {
    const keys = Object.keys(obj);
    const r = keys.map((k) => {
      const tempObj = { ...obj };
      const value = tempObj[k];
      delete tempObj[k];
      const ttt = [];
      ttt.push(k);
      const check = (value) => {
        value.forEach((e) => {
          const tk = `${e.row}_${e.col}`;
          if (k != tk && tempObj.hasOwnProperty(tk)) {
            ttt.push(tk);
            const tv = tempObj[tk];
            delete tempObj[tk];
            check(tv);
          }
        });
      };
      const color = value.find((e) => e.center).color;
      const v = value.filter((e) => !e.hasOwnProperty("center"));
      check(v);
      ttt.sort((a, b) => (a > b ? 1 : -1));
      return { v: ttt, c: color };
    });
    const removeDuplicate = r.reduce((o, e) => {
      const key = e.v.sort((a, b) => (a > b ? 1 : -1)).join(",");
      if (!o.hasOwnProperty(key)) {
        o[key] = e;
      }
      return o;
    }, {});
    const removeDuplicateAr = Object.values(removeDuplicate);
    const res = removeDuplicateAr.map(({ v, c }) => ({
      row_col: v,
      closed: v.every((f) => obj[f].length >= 3),
      c,
    }));
    this.objectFromGetEachObjectsMethod = res.map((o) => {
      const cells = o.row_col
        .map((e) => {
          const [row, col] = e.split("_");
          return `${this.columnIndexToLetter_(col)}${Number(row) + 1}`;
        })
        .sort((a, b) => (a > b ? 1 : -1));
      return { cells, closed: o.closed, color: o.c };
    });
    return res;
  }

  /**
   * ### Description
   *
   * @param {Object} obj Values from the method getEachObjects_.
   * @returns {Object[]} Object including the a1Notations and colors.
   */
  getInsideRanges_(obj) {
    const getRes_ = (type, start, end, ob) => {
      const ar = [];
      for (let r = start; r <= end; r++) {
        let temp = [];
        if (ob[r]) {
          temp = ob[r].reduce((arr, e, i, a) => {
            if (a[i + 1]) {
              const tt = [];
              for (let c = e; c <= a[i + 1]; c++) {
                tt.push(c);
              }
              tt.shift();
              tt.pop();
              arr.push(...tt);
            }
            return arr;
          }, []);
        }
        ar.push(
          ...temp.map((e) =>
            type == "row"
              ? `${this.columnIndexToLetter_(e)}${r + 1}`
              : `${this.columnIndexToLetter_(r)}${e + 1}`
          )
        );
      }
      return ar;
    };

    const res = obj.reduce((ar, o) => {
      if (o.closed) {
        const t = o.row_col.map((e) => e.split("_").map((f) => Number(f)));
        const or = t.reduce(
          (oo, [a, b]) => (
            (oo[a] = oo[a] ? [...oo[a], b].sort((c, d) => c - d) : [b]), oo
          ),
          {}
        );
        const oc = t.reduce(
          (oo, [a, b]) => (
            (oo[b] = oo[b] ? [...oo[b], a].sort((c, d) => c - d) : [a]), oo
          ),
          {}
        );
        const tr = t.map((e) => e[0]);
        const tc = t.map((e) => e[1]);
        const startRowIdx = Math.min(...tr);
        const endRowIdx = Math.max(...tr);
        const startColIdx = Math.min(...tc);
        const endColIdx = Math.max(...tc);
        const se = getRes_("row", startRowIdx, endRowIdx, or);
        const sf = getRes_("col", startColIdx, endColIdx, oc);
        ar.push({ ranges: se.filter((e) => sf.includes(e)), color: o.c });
      }
      return ar;
    }, []);
    return res;
  }

  /**
   * ### Description
   * Fill in the closed objects in the sheet with colors.
   *
   * @param {Object} obj Values from the method getInsideRanges_.
   * @returns {void}
   */
  fillIn_(object) {
    if (object.length == 0) return;
    object.forEach(({ ranges, color }) => {
      if (ranges.length > 0) {
        this.sheet.getRangeList(ranges).setBackground(color);
      }
    });
  }

  /**
   * ### Description
   * Convert column index to column letter.
   * Ref: https://stackoverflow.com/a/53678158
   *
   * @param {Number} index Column index.
   * @returns {String} Column letter.
   */
  columnIndexToLetter_(index) {
    const a = Math.floor(index / 26);
    return a >= 0
      ? this.columnIndexToLetter_(a - 1) +
          String.fromCharCode(65 + (index % 26))
      : "";
  }
}
This class offers functions for analyzing and modifying colored cell regions in a Google Sheet:
run: The primary function that triggers the entire process.getInitValues_: This function retrieves the initial background color information for a given range of cells.getObject_: This function gathers the coordinates of colored cells and the cells directly surrounding them.getEachObjects_: This function identifies each distinct colored cell region and verifies if they are fully enclosed by other cells.getInsideRanges_: This function retrieves the coordinates of uncolored cells located within each identified region.fillIn_: This function fills the cells within closed regions with a designated color.
3. Sample script 1
Please copy and paste the following script to the script editor and save the script.
function onChange(e) {
  if (e.changeType != "FORMAT") return;
  const sheet = SpreadsheetApp.getActiveSheet();
  const range = sheet.getRange(1, 1, sheet.getMaxRows(), sheet.getMaxColumns());
  const f = new FillInCells();
  f.run({ range, defColor: range.offset(0, 0, 1, 1).getBackground() });
  Browser.msgBox(
    `${f.objectFromGetEachObjectsMethod[0].closed ? "Closed" : "Opened"}`
  );
}
And, please install the OnChange trigger to the function onChange. Ref By this, the following result is obtained.
When you select several cells and set a color, a dialog is opened. And, you can see the identified result in the dialog.
4. Sample script 2
Please copy and paste the following script to the script editor and save the script.
function onChange(e) {
  if (e.changeType != "FORMAT") return;
  const sheet = SpreadsheetApp.getActiveSheet();
  const range = sheet.getRange(1, 1, sheet.getMaxRows(), sheet.getMaxColumns());
  const f = new FillInCells();
  f.run({
    range,
    defColor: range.offset(0, 0, 1, 1).getBackground(),
    fill: true,
  });
}
And, please install the OnChange trigger to the function onChange. Ref By this, the demonstration at the top of this report can be obtained.
5. Sample script 3
Please copy and paste the following script to the script editor and save the script.
function sample3() {
  const a1Notation = "'Sheet1'!A1:M6";
  const defColor = "#ffffff";
  const fill = false;
  const range = SpreadsheetApp.getActiveSpreadsheet().getRange(a1Notation);

  const f = new FillInCells();
  const res = f.run({ range, defColor, fill });

  const identifiedRegions = f.objectFromGetEachObjectsMethod;
  console.log(identifiedRegions);
  console.log(res);
}
When this script is run to the following situation,
The following result is obtained.
identifiedRegions: This is the cell coordinates of each identified cell region. color is the background color.
[
  {
    "cells": ["B2", "B3", "B4", "C2", "C4", "D2", "D3", "D4"],
    "closed": true,
    "color": "#ff0000"
  },
  {
    "cells": ["H3", "I2", "I4", "J2", "J5", "K3", "K5", "L4", "L5"],
    "closed": true,
    "color": "#0000ff"
  }
]
res: This is the cell coordinates of uncolored cells in each identified cell region. color is the background color of the surrounding cells.
[
  { "ranges": ["C3"], "color": "#ff0000" },
  { "ranges": ["I3", "J3", "J4", "K4"], "color": "#0000ff" }
]
Note
- I guess that this sample might not be suitable for a large sheet.