This is a sample script for plotting the points on an image using Google Apps Script.
Unfortunately, in the current stage, there are no methods for directly editing the image and putting the texts and some shapes in the methods for Google Apps Script. So in this case, it is required to use the workaround.
Fortunately, I have already published a report about “Inserting Text on Image using Google Apps Script” in my blog. Ref In this report, this sample is used.
Usage
1. Create Google Apps Script project.
Please create Google Apps Script project. In this case, you can use the standalone script and the container-bound script.
2. Install Google Apps Script libraries.
Please install the following Google Apps Script libraries. You can see the official document for installing the library at here.
- ImgApp
- You can see the project key for installing the library at here.
- DocsServiceApp
- You can see the project key for installing the library at here.
3. Sample script.
Please copy and paste the following script to the script editor of Google Apps Script and please set the variables.
function myFunction() {
  const fileIdOfImage = "###"; // Please set the file ID of the base image file. The points are plotted to this image.
  const outputFilename = "sample.png"; // Please set the filename of the output image.
  const coorinates = [
    { v: "A", x: 0, y: 0 },
    { v: "B", x: 0, y: 300 },
    { v: "C", x: 300, y: 300 },
    { v: "D", x: 300, y: 0 },
    { v: "E", x: 150, y: 150 },
  ]; // the coordinates for plotting points.

  // 1. Retrieve blob from an image file.
  const blob = DriveApp.getFileById(fileIdOfImage).getBlob();

  // 2. Retrieve the image size.
  const { width, height } = ImgApp.getSize(blob);

  // 3. Create new Google Slides.
  const object = {
    title: "temp",
    width: { unit: "pixel", size: width },
    height: { unit: "pixel", size: height },
  };
  const id = DocsServiceApp.createNewSlidesWithPageSize(object);

  // 4. Insert the image.
  const s = SlidesApp.openById(id);
  const slide = s.getSlides()[0];
  const image = slide.insertImage(blob);

  // 5. Plot the points using the coordinates to Google Slides.
  const pointSize = 8;
  const fontSize = 10;
  const boxSize = 60;
  coorinates.forEach(({ v, x, y }) => {
    let px = x / 1.33333 - pointSize / 2;
    let py = (-1 * (y - height)) / 1.33333 - pointSize / 2;
    slide
      .insertShape(SlidesApp.ShapeType.ELLIPSE, px, py, pointSize, pointSize)
      .getFill()
      .setSolidFill("#ff0000");
    const textBox = slide.insertTextBox(
      v,
      px - boxSize / 2 + pointSize / 2,
      py - boxSize / 2 + pointSize / 2,
      boxSize,
      boxSize
    );
    textBox.setContentAlignment(
      SlidesApp.ContentAlignment[
        (px < 0 && py > 0) || (px > 0 && py > 0) ? "TOP" : "BOTTOM"
      ]
    );
    const text = textBox.getText();
    text
      .getParagraphStyle()
      .setParagraphAlignment(
        SlidesApp.ParagraphAlignment[
          (px > 0 && py < 0) || (px > 0 && py > 0) ? "START" : "END"
        ]
      );
    text.getTextStyle().setFontSize(fontSize);
  });
  slide.group([image, ...slide.getShapes()]);
  s.saveAndClose();

  // 6. Retrieve the image blob from Google Slides.
  const obj = Slides.Presentations.Pages.getThumbnail(id, slide.getObjectId(), {
    "thumbnailProperties.thumbnailSize": "LARGE",
  });
  const outputBlob = UrlFetchApp.fetch(
    obj.contentUrl.replace("=s1600", "=s" + width)
  )
    .getBlob()
    .setName(outputFilename);
  DriveApp.createFile(outputBlob);
  DriveApp.getFileById(id).setTrashed(true);
}
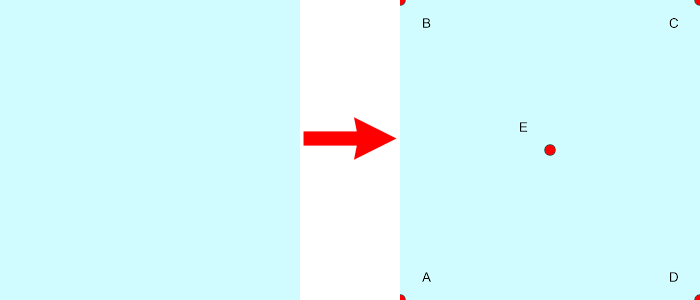
Testing.
When above script is run, the following result is obtained. The size of sample image is 300 x 300 pixels. The left and right images are before and after the script is run. You can see that the points are plotted on the image. In this sample, the origin of this plot is the lower left.
References
- Google Apps Script libraries
- Google Slides API
- I answered this sample script for this thread in Stackoverflow.